


 2021-04-10
in
2021-04-10
in

 15 min read
A couple months ago in this blog post I debuted a home grown blog/static website statistics generator that used nothing but the Nginx log data. I’ve been letting it run since then to see if it is really getting the job done for what I need: basic information about traffic to my various posts, the referrers that they came from, and maybe some information about browsers/OS’s. I was hoping that it would be lightweight, efficient, and easy to use. I’m very happy to say that I have found it to be exactly that. There are rough edges of course, this is a 1.0 release of software that is intentionally hobbled by not being able to use tracking JavaScript code etc., but it is something I’m proud of and am glad I wrote. Below I’ll be exploring how I use it and what improvements I can see making.
Introduction
You should read the detailed writeup in this original post but the short version of the purpose of the project was that I wanted blog statistics like I had on my old Wordpress site but without the need for any of the usual JavaScript tracking software that goes along with it. That constraint is really about me trying to live the talk of avoiding unnecessary tracking stuff. Why not research existing tools that do this? That was primarily driven by my desire to experiment with potentially Kotlin Native application migration. This is an application factored such that it’s 90% of the way towards being able to be native. Also a lot of those tools add additional pieces of software and/or services that have to run. I just wanted a simple self contained application that runs as a command line tool and interacts with files without having any privilege escalations.
The tool has a few modes that it can run in:
- Ingestion: This mode reads the latest unzipped Nginx log files, processes the entries and stores new entries in the local SQLite database. Entries which don’t pass the filtering criteria passed in are not stored in the database. This is needed to cut down on the substantial number of non-relevant accesses that hit the server from bots.
- Summarize: This mode processes the database and generates a summary text file showing information like monthly top ten statistics, etc. This can be run in the same command with ingestion, with ingestion happening first.
- Find Bad IP: This helps with finding non-real users. It flags IP addresses in the database that fit the threshold settings passed in. For example a user can say that any IP address that had more than 4 accesses in ten seconds should be listed as a bad ip. It dumps the list of potentially bad IP’s to the CLi.
- List IP: Lists all of the access entries for a given IP address. This can be used to help diagnose whether an IP is legitimate or not.
- Apply Filters: Once the filter settings are changed they need to be applied against the existing database. Running this command goes through every entry in the database and applies the current settings. This is done non-destructively (in the current version anyway) by changing the “hidden” flag. Hidden entries do not show up in the statistics
Real World Usage
I tried to make the documentation on the project’s Gitlab site as comprehensive as possible. I did the same with the command line tool help with the “–help”. This part of the post is about me dogfooding my own application. The question is: “Does it work well enough that I don’t need to know about the internal workings, looking at the code, or cracking open database files to get my job done.” The answer is a big “yes”! I have been able to use nothing but the command line tool to get statistics and fine tune the filtering settings to weed out new bots/spiders/non-real users. Let’s look at what my actual configuration and workflow looks like.
Automated Run Configuration
First order of business is the regular generation of data by scraping of the current Nginx logs. I originally was going to write file triggers etc, and if my blog ever got busy enough that the logs rolled over faster than every hour then I may ultimately do that. It probably won’t come to that though. Instead right now there is a cron job which executes the tool in ingestion/summarize mode. There is a simple shell script in the process user’s home folder which the cron job is configured to run:
#!/bin/bash
java -Dorg.slf4j.simpleLogger.showDateTime=true \
     -Dorg.slf4j.simpleLogger.dateTimeFormat="YYYY-MM-dd'T'HH:mm:ss" \
     -jar ~/statstool/bin/blogstatviewer-1.0-SNAPSHOT-all.jar \
     --ingest \
     --summarize \
     ~/statstool/config/settings.json
Cron text:
*/30 * * * * ./analysis.sh 2>> /home/<USERNAME>/statstool/log/output.log
At the current rate of traffic this is more than frequent enough. Looking at the log history since I turned the thing on a couple months ago you can see that most of the times it’s adding at most a handful of new real post views. Many of the spikes are from bots that made it through the filter settings at the time they were run and that get pruned out later. That’s especially true for that morning of April 6th which was hit 435 times by the same computer (I cropped it to make the graph more meaningful).
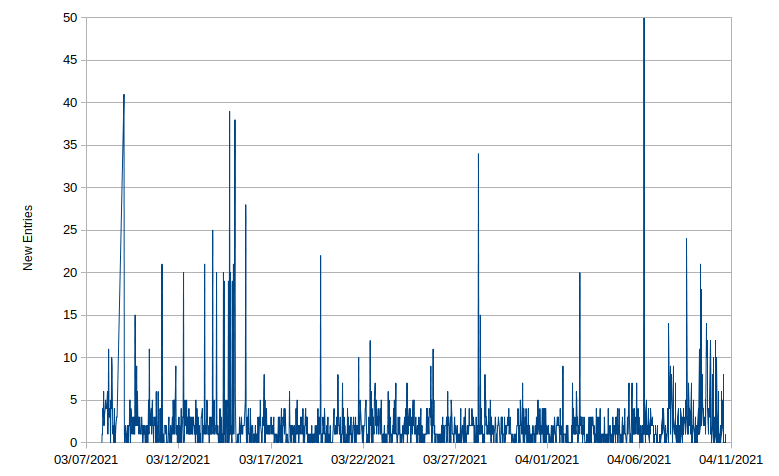
Figure 1: New blog post view entries in blogstat processing log
So the tool happily runs every half an hour, picks up the handful of new entries that came over that period of time, generates the latest statistics, and then quits. The idea was that I could have something on my desktop machine that regularly transfered the summary file down but I haven’t felt the need to do that. Instead it’s something I just check on every few weeks. I log into the server and then go through a process of tweaking the filter settings if necessary and then looking at the summary statistics. That process looks like the following.
Updating Filters and Getting Statistics
The first thing I do is I backup the summary file so that I can see what the effect is from the potentially tweaked filter settings. This also provides a rolling history of the various summaries over time (for which practical purpose I have no idea). Since I haven’t used the tool recently and haven’t run it for months and years I then need to consult the help to see what the command syntax is again by running it with the --help option. The fact I do not need to consult the blog manual I wrote is a big triumph in my book. The mode I’ll be looking for is the “find bad IPs” mode. That is executed today for me as:
java -jar statstool/bin/blogstatviewer-1.0-SNAPSHOT-all.jar --find-badip statstool/config/settings.json
The log output from today flagged two new potentially bad IPs:
[main] INFO BlogStatViewerMain - Blog Stat Viewer
[main] INFO BlogStatViewerMain - Performing Suspicious IP Analysis of dataset
[main] INFO BlogStatViewerMain - Studying 5698 entries
[main] INFO BlogStatViewerMain - Flagged potentiall suspicious IPs: [AAA.AAA.AAA.AAA, BBB.BBB.BBB.BBB]
[main] INFO BlogStatViewerMain - COMPLETE
This gives me enough information to start diving into these particular IP addresses by using the listing mode. For example running this for the first IP address with this command:
java -jar statstool/bin/blogstatviewer-1.0-SNAPSHOT-all.jar --list-ip AAA.AAA.AAA.AAA statstool/config/settings.json
Produces output like this:
[main] INFO BlogStatViewerMain - Blog Stat Viewer
[main] INFO BlogStatViewerMain - Performing Suspicious IP Analysis of dataset
[main] INFO BlogStatViewerMain - IP Address   = AAA.AAA.AAA.AAA
Access Time  = 2021-03-25T18:48:54Z,
Request Path = /2020/01/01/open-sounce-activities-2019/
Referrer     = -
User Agent   = Mozilla/5.0 (Windows NT 10.0; Win64; x64) AppleWebKit/537.36 (KHTML, like Gecko) Chrome/65.0.3325.162 Safari/537.36
Hidden       = false

[main] INFO BlogStatViewerMain - IP Address   = AAA.AAA.AAA.AAA
Access Time  = 2021-03-25T18:48:54Z,
Request Path = /2020/01/01/open-sounce-activities-2019/
Referrer     = http://www.nequalsonelifestyle.com/2020/01/01/open-sounce-activities-2019/
User Agent   = Mozilla/5.0 (Windows NT 10.0; Win64; x64) AppleWebKit/537.36 (KHTML, like Gecko) Chrome/65.0.3325.162 Safari/537.36
Hidden       = false

[main] INFO BlogStatViewerMain - IP Address   = AAA.AAA.AAA.AAA
Access Time  = 2021-03-25T18:48:58Z,
Request Path = /2021/01/01/annual-review-2020/
Referrer     = -
User Agent   = Mozilla/5.0 (Windows NT 6.3; WOW64) AppleWebKit/537.36 (KHTML, like Gecko) Chrome/37.0.2062.124 Safari/537.36
Hidden       = false

[main] INFO BlogStatViewerMain - IP Address   = AAA.AAA.AAA.AAA
Access Time  = 2021-03-25T18:48:58Z,
Request Path = /2020/01/01/open-sounce-activities-2019/
Referrer     = -
User Agent   = Mozilla/5.0 (Windows NT 6.3; WOW64) AppleWebKit/537.36 (KHTML, like Gecko) Chrome/37.0.2062.124 Safari/537.36
Hidden       = false

...


[main] INFO BlogStatViewerMain - IP Address   = AAA.AAA.AAA.AAA
Access Time  = 2021-03-25T18:49:01Z,
Request Path = /2021/03/09/homegrown-sans-js-tracker-blog-stat-tool/
Referrer     = -
User Agent   = Mozilla/5.0 (Windows NT 6.3; WOW64) AppleWebKit/537.36 (KHTML, like Gecko) Chrome/37.0.2062.124 Safari/537.36
Hidden       = false

[main] INFO BlogStatViewerMain - IP Address   = AAA.AAA.AAA.AAA
Access Time  = 2021-03-25T18:49:01Z,
Request Path = /2021/03/09/homegrown-sans-js-tracker-blog-stat-tool/
Referrer     = http://www.nequalsonelifestyle.com/2021/03/09/homegrown-sans-js-tracker-blog-stat-tool/
User Agent   = Mozilla/5.0 (Windows NT 6.3; WOW64) AppleWebKit/537.36 (KHTML, like Gecko) Chrome/37.0.2062.124 Safari/537.36
Hidden       = false
This regular access pattern of two requests at the exact same time, waiting a second, and then moving on to new links is a pretty common bot access pattern. Often it’s a double access for the same URL too. The worst offenders are ones where they just slam the site with dozens of requests per second. For this reason I have my current “Bad IP” setting set to more than 3 accesses within a one second window. Why not two? It is possible for a human to have done a fast click through of two articles within a second if they are queuing up tabs. I’ve done it. Three however is pretty specious. With these two IP addresses being confirmed I then go into the filter configuration file and add them to the list of blocked IPs. You can see an example filter configuration file here . With these modifications I now want to apply it to the existing database entries so run the tool in “apply filters” mode:
java -jar statstool/bin/blogstatviewer-1.0-SNAPSHOT-all.jar --apply-filters statstool/config/settings.json
This ran in a few seconds producing the following output:
[main] INFO BlogStatViewerMain - Blog Stat Viewer
[main] INFO BlogStatViewerMain - Updating entries with new filter
[main] INFO BlogStatViewerMain - Entries in database: 6293
[main] INFO BlogStatViewerMain - Entries for updating: 1036
[main] INFO BlogStatViewerMain - Successfully updated: 1036
[main] INFO BlogStatViewerMain - Update complete
[main] INFO BlogStatViewerMain - COMPLETE
So out of nearly 6300 entries that have been recorded since I setup the software 1036 were updated with new hidden status which will affect whether they show up in the statistics or not. Now I re-run the tool using the standard shell script to get new entries and compare the output with a diff tool to see what the current state of the statistics are. I’m looking for potentially still robot accesses but ones that didn’t get picked up in the “bad IP” tool. For example there were three IP addresses with more than 70 hits within one month. For this I again use the listing tool to see if I can divine whether it is robotic or not. In two cases the referrer string helped me determine that the were bots. Even without the referrer string their very methodical access cadence would have given it away. The last one though looked legitimate. I’ve been known to “walk a blog” before so it’s not uncommon. Could it be a bot but with a more complex access pattern? Perhaps. I’ll be leaving it in for the time being though.
My configuration settings are stored in a local git repository so that if I screw up I can always revert to a prior version. It also lets me diff those over time. With those changes committed I now have the updated statistics (which I’ll share in another post) that are picked up the next time the script runs automatically on the hour or half hour.
Analysis
After two complete months of the system running, now starting its third, I can get some reasonable metrics on utilization and user impact. First, the user experience in terms of maintaining the filters is perfect for me. The entire filter tweaking process above takes me only a few minutes. The fact I only need to do that once every few weeks means that it’s a grand total of maybe 5-10 minutes a month tops to keep things going, at least for my lightly trafficed blog. Being able to use a combination of IP and agent blockers makes the process more scalabale than it sounds. In terms of system overhead it is as light as I could have hoped for even without the algorithm being optimized especially well. The next two charts show how lightweight it is:
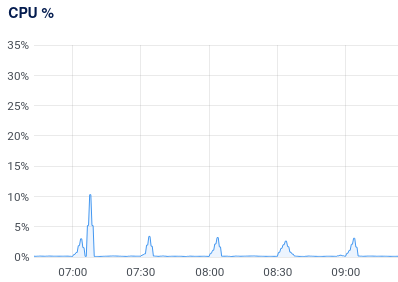
Figure 2: Server CPU Usage Chart
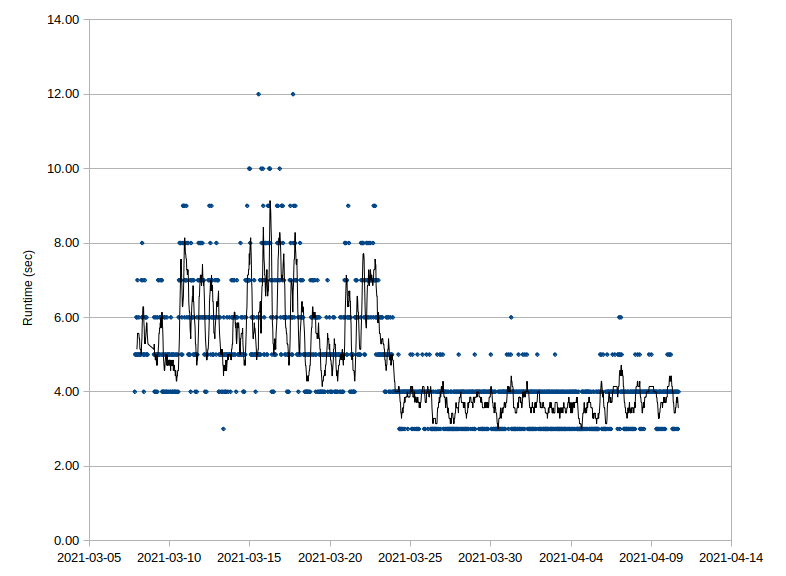
Figure 3: Blogstat tool run time history chart
The first chart shows a zoomed in view of the CPU utilization history. It’s zoomed in so that the time sampling can catch the “spike” which tops out at just a few percent of the CPU. In actuality it’s just a few seconds of spiking which doesn’t have time to register as a full CPU hit. In terms of actual run time the second chart shows the actual log history of all of the automatic runs since the software was installed. Early on I didn’t have a lot of the non-generic filters configured. After a couple weeks I did the above process to tweak them. That dramatically lowered the number of entries that made it through needing actual processing. As one can see though even worst case it was taking on average less than ten seconds to run every half an hour. Now it’s more like 3-4 seconds. In terms of storage and number of entries it’s not bad either. Even with all the initial run noise it has about 6300 entries, so just over 3000 a month. It’s probably way less than that with the new settings. Even still it’s 2.8 MB of disk space to stare the database. So overall I’m pretty content with the performance of the tool and how to use but I can still see areas of improvement.
Potential Improvements
First thing I’d look into adding are a couple of new processing modes. For example I’d like to be able to run a query to see the access timeline for a specific post. The data is all there to make that happen I just don’t have it wired up. I’d also like to create a timeline/trend mode that would allow me to see that blog-wide as well. Related to that I need to have a mode that dumps the data into a CSV style format that is easy to graph. Right now it is very much optimized for me to be able to read it but not process it regularly. If I were to create a specific CSV format it would be a trivial process to dump the data into a spreadsheet or run a simple python script to get there. If there was a platform native Kotlin library for graphing I’d consider using that as well. With respect to the data itself I am also considering having a command option to prune the hidden entries, which are more often than not garbage that got through the previous configuration of the filter. I imagine this as a cleanup operation not an automated thing. I also imagine I’d only be doing this once performance or size requires it.
Beyond actual features there is some refactoring I am considering as well. First, and most probably, I’ll be refactoring the command line processing. This was my first project using a Kotlin library for command line processing called Clikt . I had a very good experience with it here so have used it elsewhere. The more I’ve used it the more I realize I did not use it very well in this first project though. I’d like to go back and fix that. It’ll change the calling structure but it will make it more flexible and more idiomatically correct. I’d also like to explore if there is a more efficient way to do the blog processing. It’s not the end of the world since it still only takes a few seconds but it’s essentially reprocessing the same file over and over. That’s especially true for the log file ending in “.1” which doesn’t change at all. I could make it only process the primary one but if it misses a roll over then I’m screwed. This optimization maybe one of those things I’ll look at if processing times jump dramatically.
Lastly I still would like to turn this into a pure Kotlin Native application. The easiest blocker to overcome on that is the file/folder access. In this blog post
I documented an easy way to work with File I/O in Kotlin Native. Those techniques are more than sufficient for what I’d need to do here. I would just need to implement the comparable directory walking native routines. The next hardest thing will be replacing the SHA-256 hash generator with one that calls into the native code. Again that isn’t too complicated since there are system calls I can use for that, or even worst case CLI calls (which is not advised). The hardest part will be the database layer. It is isolated off to its own class (source code here)
using the Exposed SQL adapter
by JetBrains. While it would be great that it is ultimately written in a way that would support Kotlin Native it seems too tied to the JVM for that to be a reality. Instead I imagine I could write a class that implements the same AccessLogRepository interface using native interop calls into the SQLite C/C++ Library
. This would be non-trivial but it could be a useful exercise. Being able to do that sort of swap out simply is why I intentionally implemented this using a Repository Design Pattern
with a factor method creating it when requested. None of these changes are necessary at this time though so these are definitely back burner issues for me.
Conclusion
In the end I’m very happy with the performance of this non-tracking blog/static site statistics tool I created.