


 2022-08-08
in
2022-08-08
in

 12 min read
This is the second part of the PHP and Friendica Debugging Post Series . It is assuming that you have a ready to go Ubuntu 22.04 Linux computer or virtual machine ready for configuration, with sudo privileges for your user account. You can follow this post on how to get one configured in Parallels Desktop on macOS. At the end of this tutorial you will be able to do step-level debugging of a locally hosted PHP site on your computer using the PHPStorm IDE.
Install Apache2 and PHP
We will install Apache and PHP using the standard package manager:
sudo apt update
sudo apt install -y apache2 php libapache2-mod-php
After this completes you should be able to go into the web browser and go to the localhost site at http://localhost and see the standard Apache screen:
But we want to make sure that PHP is running as well. We do this by putting a simple PHP info page in the same directory. With your favorite editor (I’m going to use nano here) open a new file called info.php in the root of the web folder:
sudo nano /var/www/html/info.php
Past into that file this text and save it:
<?php

phpinfo();

phpinfo(INFO_MODULES);
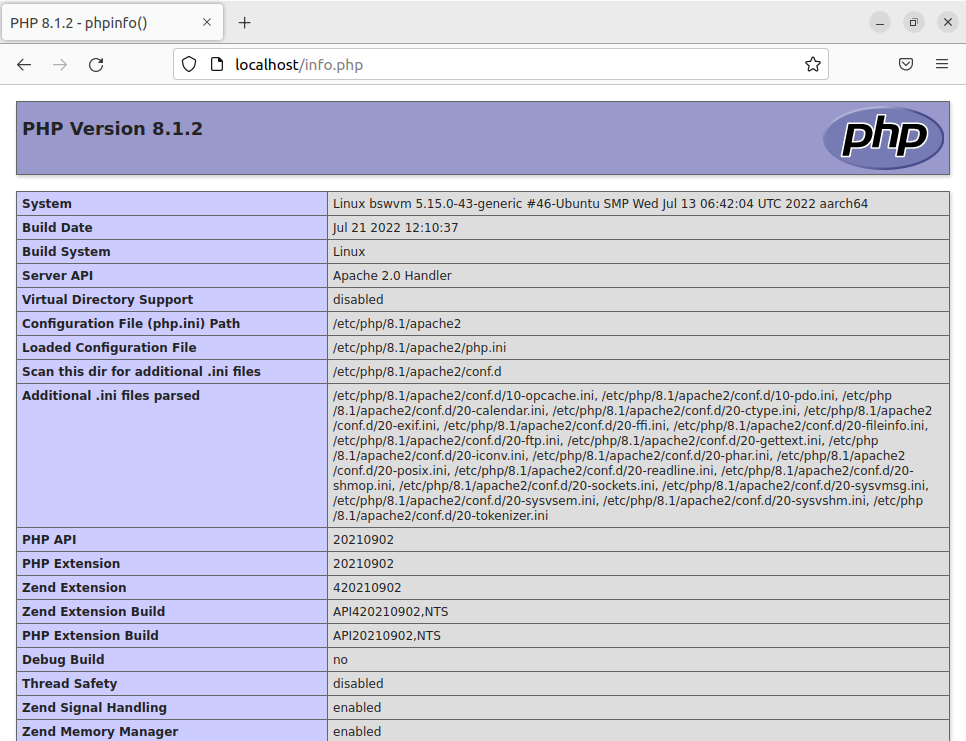
This will create a page showing the php information and module information. If you navigate to http://localhost/info.php you should get a screen that looks like this:
Setting up User Permissions
We will want to be able to interact with the folder our sites are stored in from our regular user. We will do this by changing the ownership to be by the www-data user and group and to add our user to the www-data group. First let’s change the ownership of the top level www folder and everything underneath:
sudo chown -R www-data:www-data /var/www
We also want to make it so that the group has write permissions to the top level www folder and everything underneath:
sudo chmod -R g+w /var/www
Lastly we want to add our user to the www-data group. In this below example the user in question is named user1, replace this with your username:
sudo usermod -aG www-data user1
Finally login/out and/or reboot. Now when you open the info.php file without sudo you should see it come up without the read only warning. This will allow us to directly work in this directory moving forward without sudo’ing everything.
Setup Local Apache HTTPS System (Optional)
If you are going to want to have an HTTPS connection for your web site, which we will for Friendica, we need to setup Apache for HTTPS connections. If we were doing a production, internet facing system, like in the Creating a Friendica Server post then we would use LetsEncrypt to create a certificate and configure Apache. Because this is a local only instance we will have to do several of those steps manually.
First lets make some local certificates for us to use. These are going to be locally created/signed certificates so we will get a warning when we navigate to it that we need to accept. This is not how one should do it for a production machine. Again, use LetsEncrypt and the Certbot for production machines. First we will make a directory for the certificates and navigate into it:
sudo mkdir /etc/apache2/certificate
cd /etc/apache2/certificate
Now lets create a local certificate for our site:
sudo openssl req -new -newkey rsa:4096 -x509 -sha256 -days 365 -nodes -out apache-certificate.crt -keyout apache.key
You will be prompted for a bunch of information. Because this is a local certificate it really doesn’t matter what you put into it. Just hit enter for every prompt. The only exception to that is the “Common Name” prompt. This would be where you would put “myawesomedomain.com” or whatever in a real certificate. Certain app sysems, like Flutter, require you to have that name filled in and matching whatever you will be referencing your server as. In our example we would fill it in with “localhost”. Leaving it blank or putting in something else will result in not being able to connect from those applications even if you are making exceptions for self-signed certificates. Afterward however you should get a directory listing when you do ls -l that looks like:
-rw-r--r-- 1 root root 1939 Aug  7 16:51 apache-certificate.crt
-rw------- 1 root root 3272 Aug  7 16:51 apache.key
These are now the keys we can use for our Apache HTTPS sites. Now we need to enable the SSL, header modification, and rewrite capabilities of our Apache server:
sudo a2enmod ssl
sudo a2enmod rewrite
sudo a2enmod headers
sudo systemctl restart apache2
We now need to prepare our HTTPS site to use the certificates that we just created. edit the default-ssl.conf file with your favorite editor:
sudo nano /etc/apache2/sites-available/default-ssl.conf
You will see lines within the site configuration that read:
SSLCertificateFile      /etc/ssl/certs/ssl-cert-snakeoil.pem
SSLCertificateKeyFile /etc/ssl/private/ssl-cert-snakeoil.key
You will want to replace these values with the locations of your two files so it will now read:
SSLCertificateFile /etc/apache2/certificate/apache-certificate.crt
SSLCertificateKeyFile /etc/apache2/certificate/apache.key
Now enable the default-ssl site and restart the Apache service:
sudo a2ensite default-ssl.conf
sudo systemctl reload apache2
Now when you go to the http://localhost URL it should still work but when you go to the https://localhost URL you should be prompted for a warning about a potential security problem since we are using an unsigned certificate:
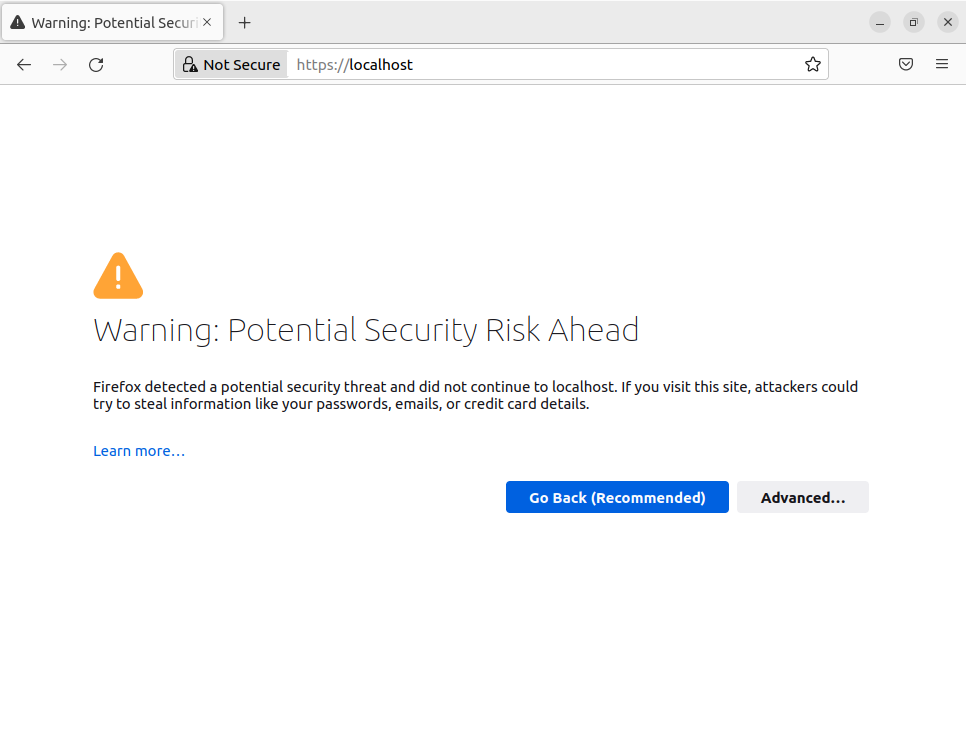
Hit the “Advanced” button and then when presented with the below screen the “Accept Risk and Continue” button:
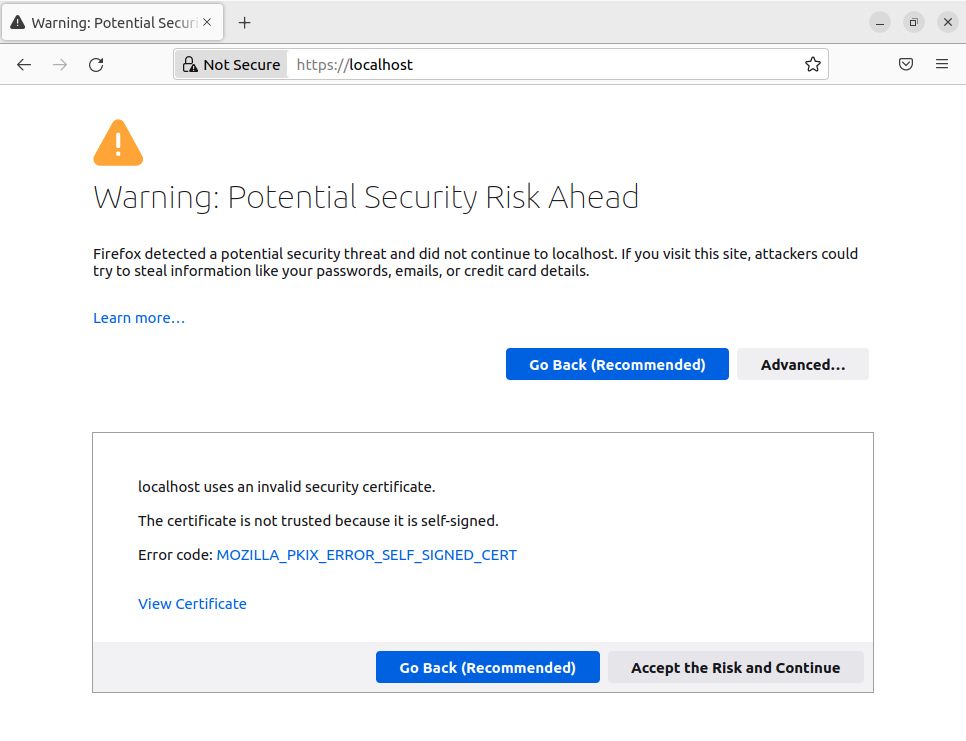
You will now be presented with the same default screen as when you go to the HTTP version of the URL.
Installing Xdebug
Now we will install the Xdebug module:
sudo apt install php-xdebug
sudo systemctl restart apache2
We want to confirm Xdebug is installed both from the PHP command line as well as within Apache. To test that it is installed correctly from PHP command line execute the following command:
php --version
You should see output like:
PHP 8.1.2 (cli) (built: Jul 21 2022 12:10:37) (NTS)
Copyright (c) The PHP Group
Zend Engine v4.1.2, Copyright (c) Zend Technologies
    with Zend OPcache v8.1.2, Copyright (c), by Zend Technologies
    with Xdebug v3.1.2, Copyright (c) 2002-2021, by Derick Rethans
The important line for this is the Xdebug line. To test this for PHP add a new file to the site which we will call xdebug_info.php:
nano /var/www/html/xdebug_info.php
…and paste into it this code and save it:
<?php
xdebug_info();
When you navigate to https://localhost/xdebug_info.php in your browser it should display:
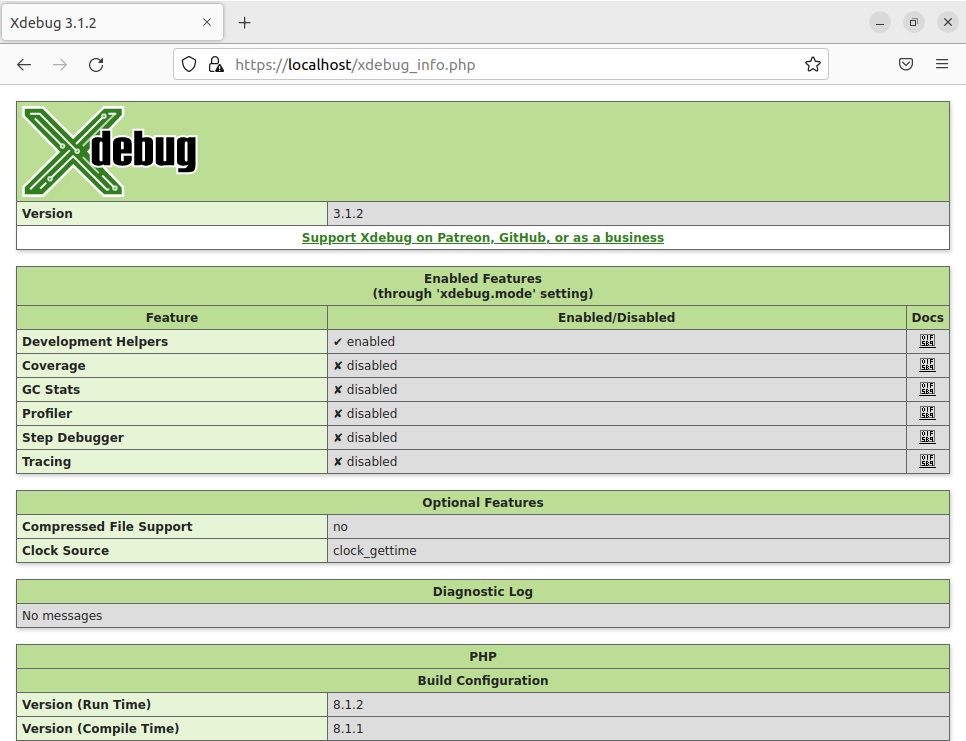
Now lets configure each of the environments to allow debugging. There will be two ways we want to debug, through the command line and through Apache. By default they share a common linked configuration file for Xdebug settings in /etc/php/8.1/mod-available/xdebug.ini. Because we want debugging on both we will edit this file:
sudo nano /etc/php/8.1/mods-available/xdebug.ini
To this file we will add the line xdebug.mode=debug so it should read:
zend_extension=xdebug.so
xdebug.mode=debug
Then restart Apache for the change to take effect:
sudo systemctl reload apache2
We are now ready to start debugging our PHP code.
Install PHPStorm and Xdebug Helper Browser Plugin
PHPStorm is a JetBrains PHP IDE. There are additional IDEs that can probably do the same interactive debugging but this is the choice for this tutorial. You will probably need to ensure that OpenJDK 11 is installed for PHPStorm to run. If when you type which java nothing comes up then install it with sudo apt install openjdk-11-jdk.
Go to the JetBrains PHP Storm Website
and download a copy. Unzip and copy it into a directory. Once copied in, in a terminal go into the bin directory and run phpstorm.sh to launch the application. If you have a license apply that or do the 30 day free trial.
We also want to install the browser helper that will allow us to put our site into debug mode. JetBrains provides a list of good options for this. I used the Xdebug Helper plugin under Firefox for my system.
Creating and Running a CLI Project in PHP Storm
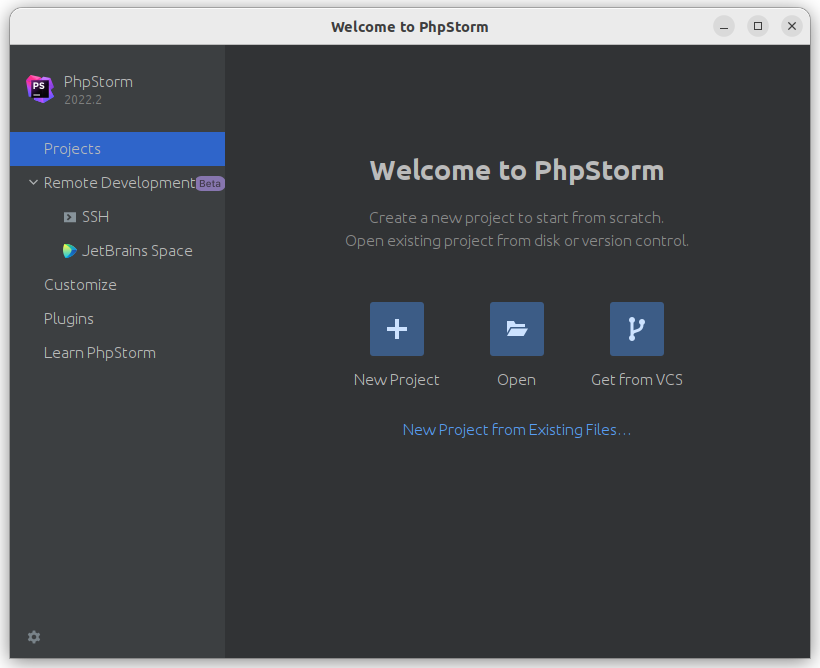
With this we now should have a fully configured PHP debugging system. to prove this lets prove this first by using PHPStorm for doing command line debugging. From the PHPStorm IDE create a new project using either the New Project button on the Welcome screen, if it is still up, or the File->New menu.
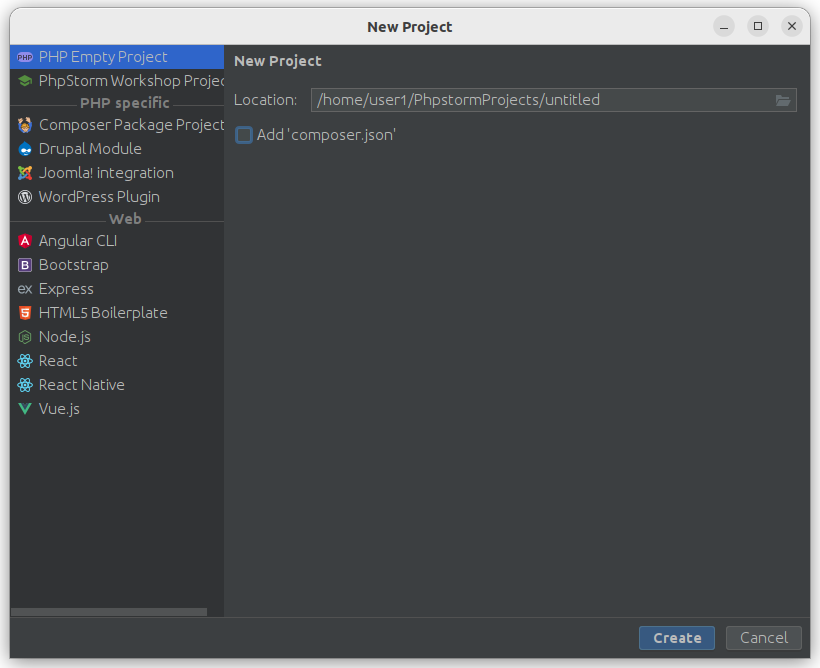
On the New Project wizard select “PHP Empty Project” and leave the rest of the defaults. Hit the “Create” Button
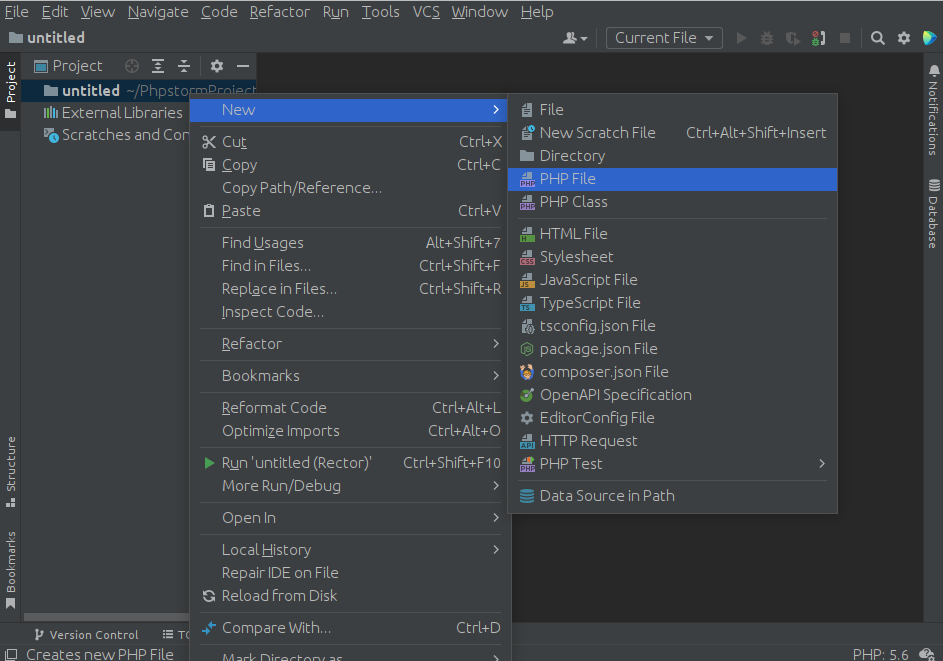
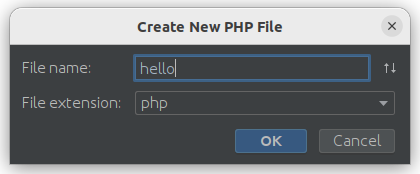
Once the IDE finishes initalizing lets create a new PHP file for us to put some sample code in. Right-click on the project folder and select the New->PHP File menu option
This will come up with a new dialog box. Fill in “hello” for the top text field and leave the extension drop down the same:
You now have a file that we can put some code in. Let’s just echo some basic arithmatic to the screen. Add the below text to hello.php
<?php
 $x = 1;
 $y = 2;
 $z = $x + $y;
 echo ("$x + $y = $z");
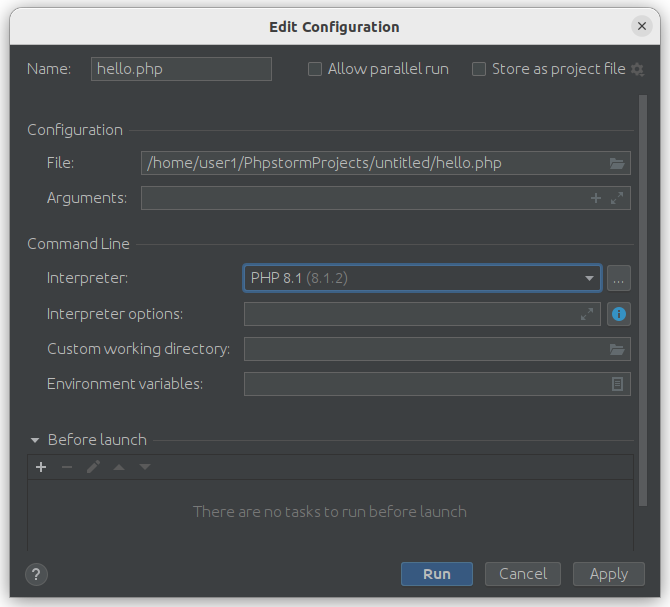
We now want to run the file. Right click on the file and hit the “Run” menu option. This will bring up a dialog box asking us to configure this system, seen below.
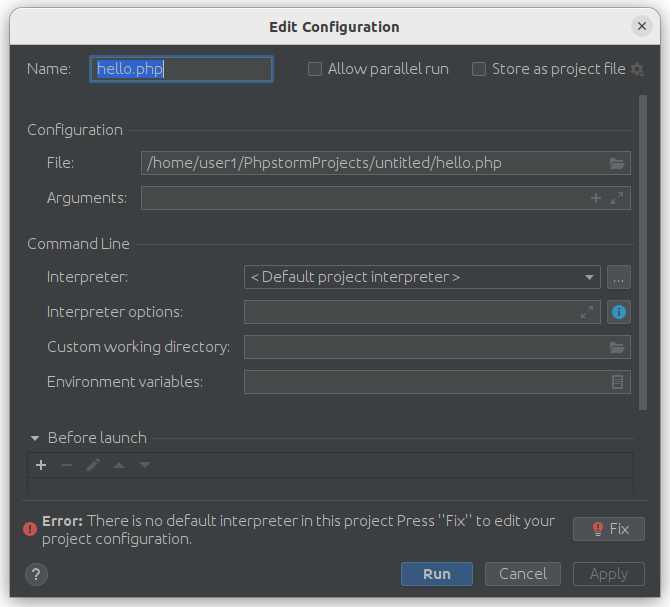
Out of the box PHPStorm doesn’t know which PHP interpreter to use. We are going to want to add a new default interpreter. Click on the ellipsis button at the end of the “Interpreter line” which will bring up a new configuration window for selecting our interpreter:
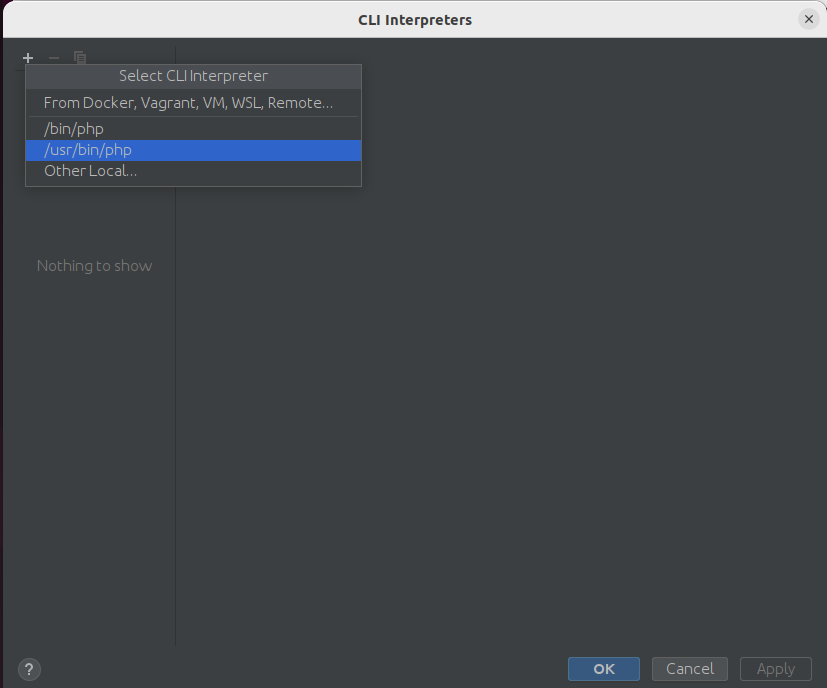
In the CLI Interpreters Dialog box (above) click the + button and select /usr/bin/php from the drop down. It will then populate the dialog box with the values from your system’s PHP configuration, as shown below:
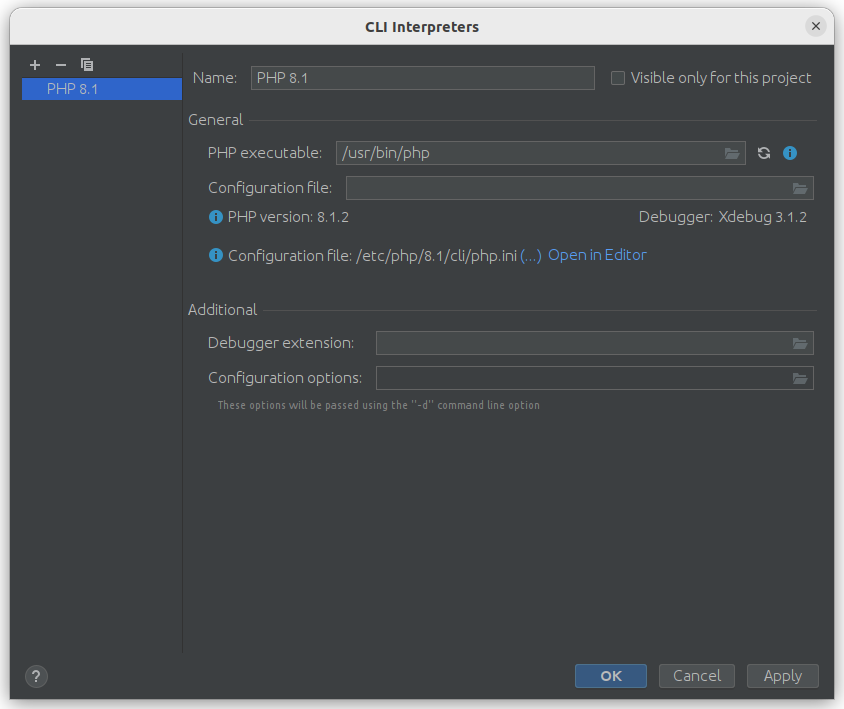
Now when you click “OK” and go back to the run configuration you can select the PHP 8.1 option if it isn’t filled in already and hit the “Run” button to run.
After running you will see the run outputs in the panel at the bottom of the window.
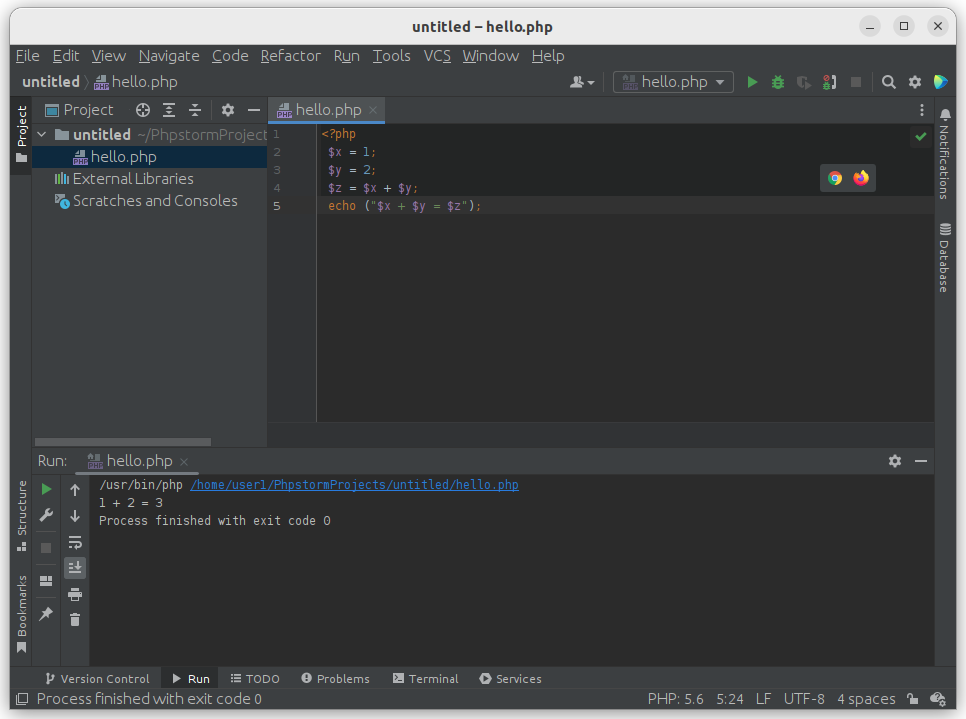
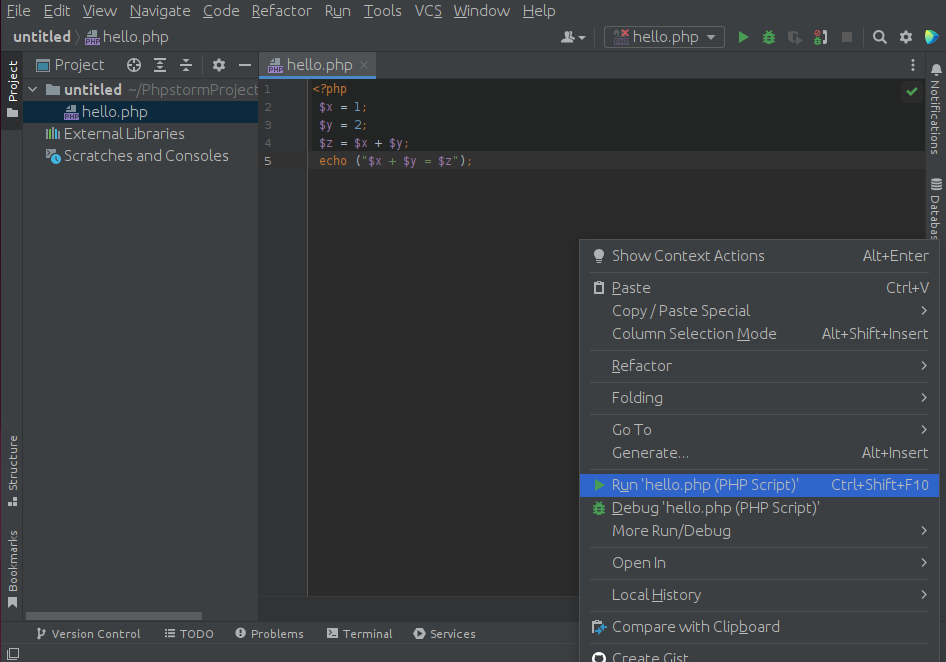
To run again you can click the run arrow in the run toolbar at the top or right-click on the file again and just use the run option as below:
Debugging a CLI Project in PHP Storm
Now that we have our simple command line project lets try to add a breakpoint and inspect the code at run time. First we need to configure one more thing about PHPStorm’s PHP runtime environment. Go into the File-Settings menu to bring up the project settings. The PHP configuration is the first thing that comes up on this dialog box, see below.
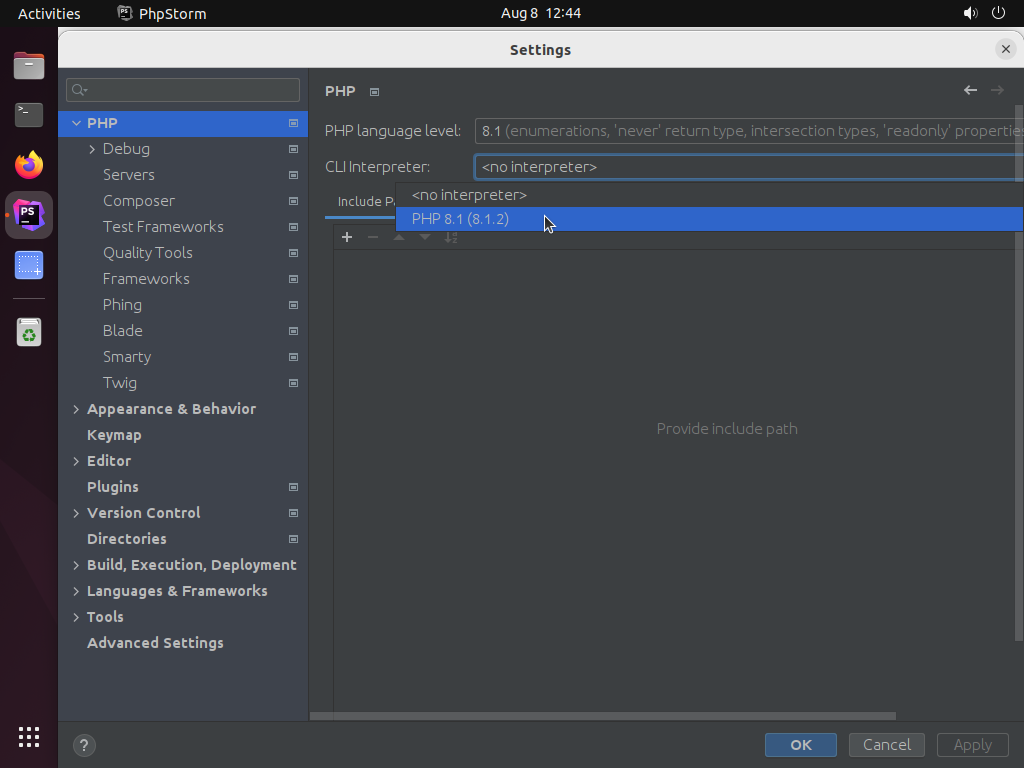
We need to define a default CLI for debugging to work. As you can see out of the gate it reads <no interpeter>. Click on it and you will see the PHP 8.1 option we used earlier. Select that and hit OK.
Now add a breakpoint to the last line that echos the output by left-clicking on the region right after the line number. Now you can either hit the debug icon in the run toolbar (the bug icon) or right click and select debug.
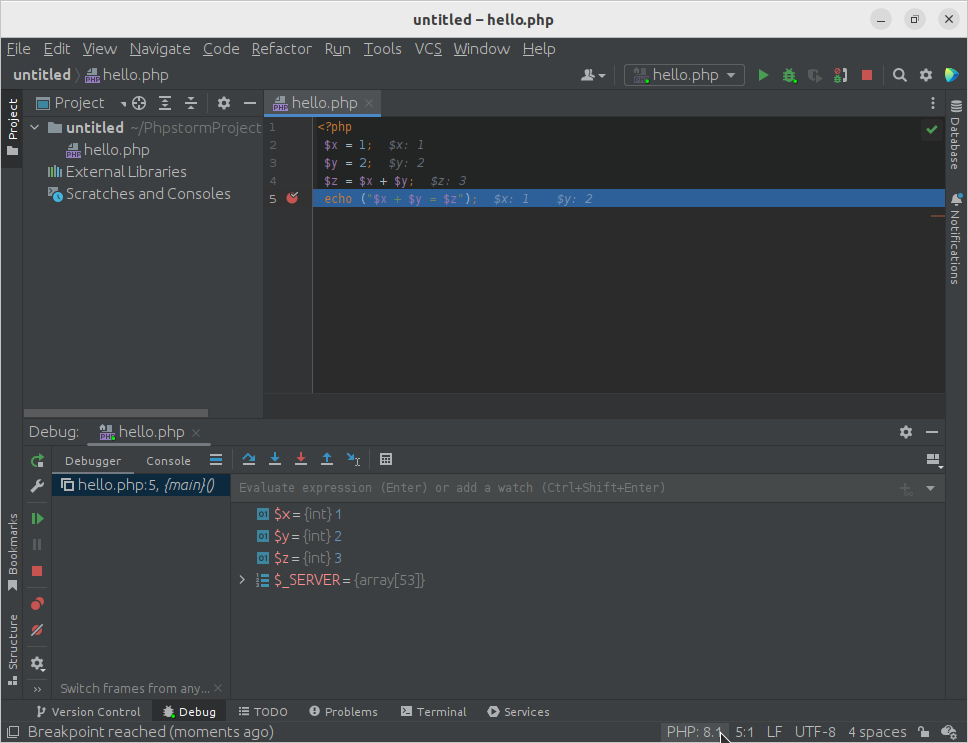
As you can see we now have panels at the bottom showing the stack trace and a variable/memory inspector. This will allow you to debug things like the Worker process.
Debugging the Apache Site in PHPStorm
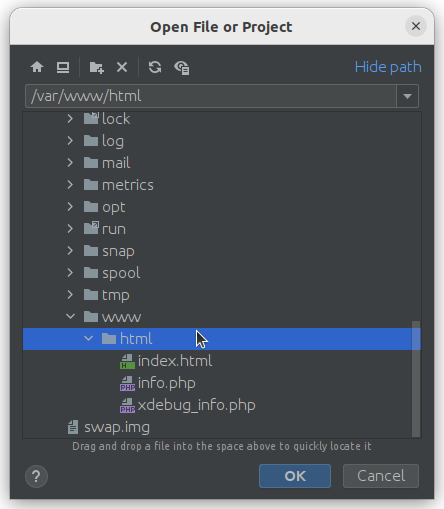
Now lets look at how to debug the Apache hosted PHP site in the /var/www/html directory. First close this project and open a new project by clicking the “Open” button on the Welcome Dialog Box if it comes up or the File->Open menu. Navigate to the /var/www/html folder and select it as below:
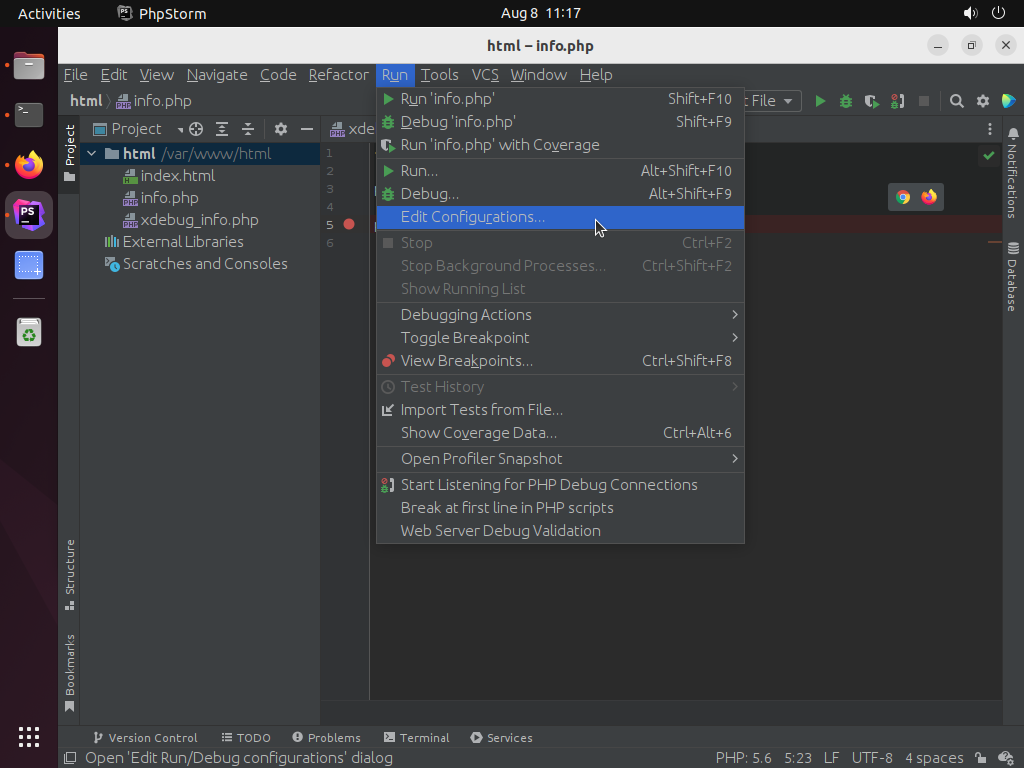
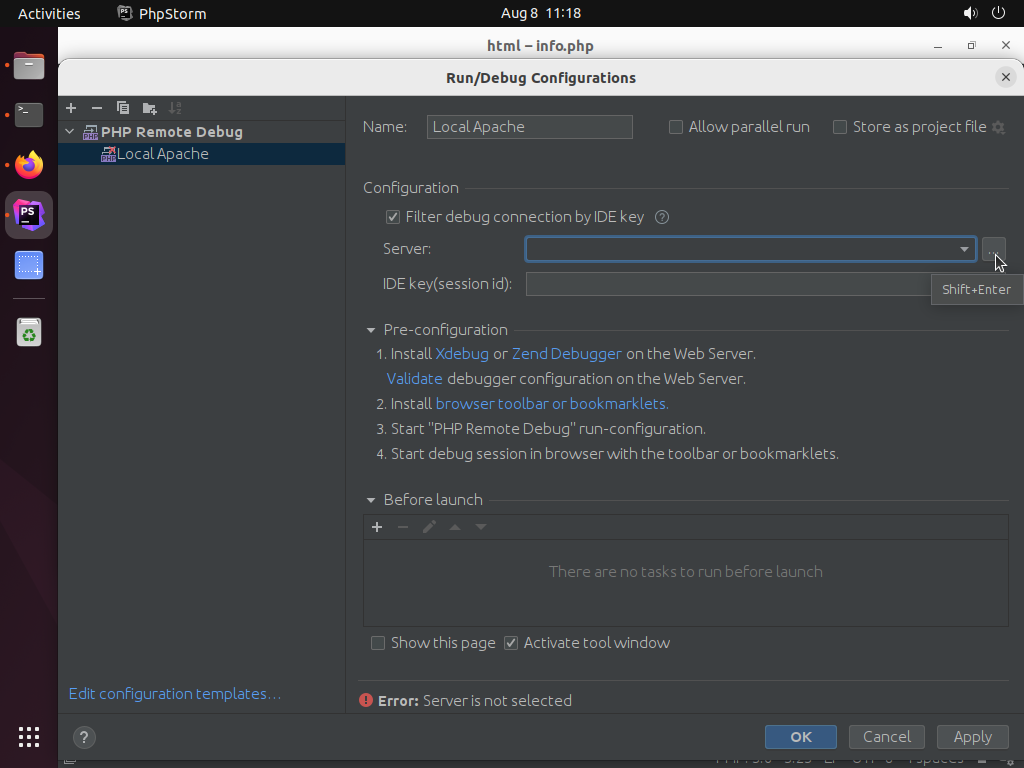
You will get a dialog box asking if you trust this project. Select that you do. To prove we can debug this we will open the info.php file and add a breakpoint to the last phpinfo line. Now we need to configure our project to know how to listen for debug events from the server. This will be different than configuring for PHP CLI debugging where PHPStorm creates and manages the process. Click on the Run->Edit Configurations… menu item (as below):
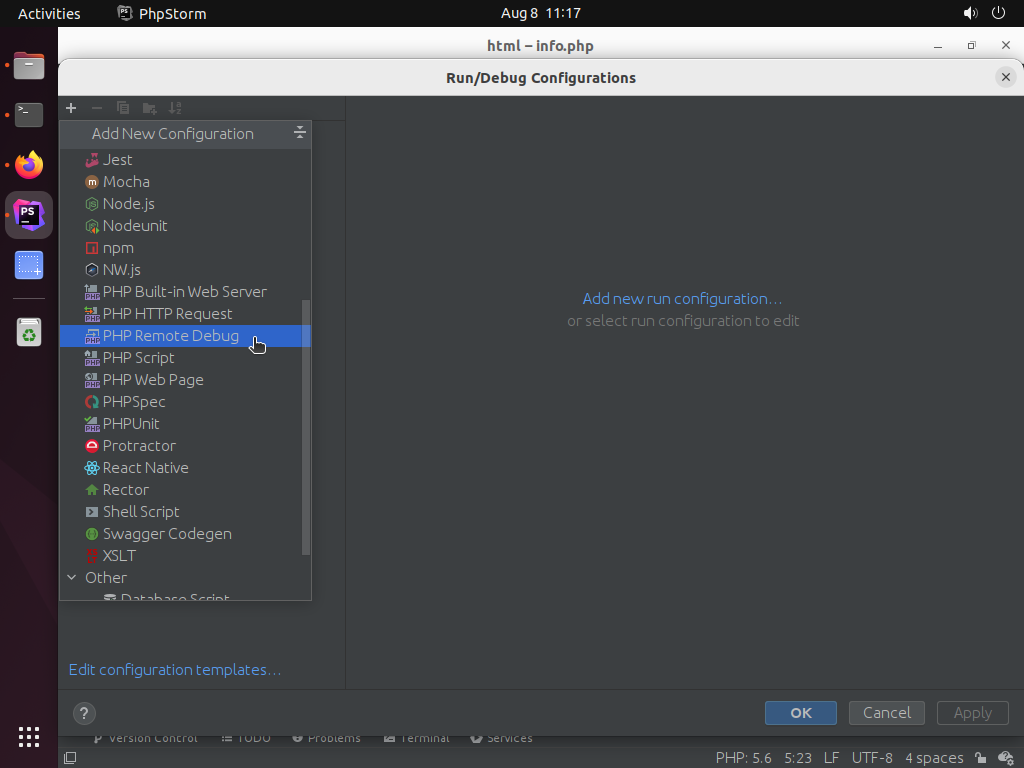
Click on the + menu and select the “PHP Remote Debug” option to create a new remote debugger run cofiguration, as below:
The first thing we will do is rename this to be “Local Apache” in the Name dialog box at the top. Then we will want to configure the server with an IDE Key. Click on the checkbox “Filter debug connections by IDE Key” as below:
Screenshot
Now we need to connect to a new server definition. Click on the ellipsis button at the far right of the “Server” line shown above. This brings up the Servers Dialog box. Click on the + button and fill in the values as below:
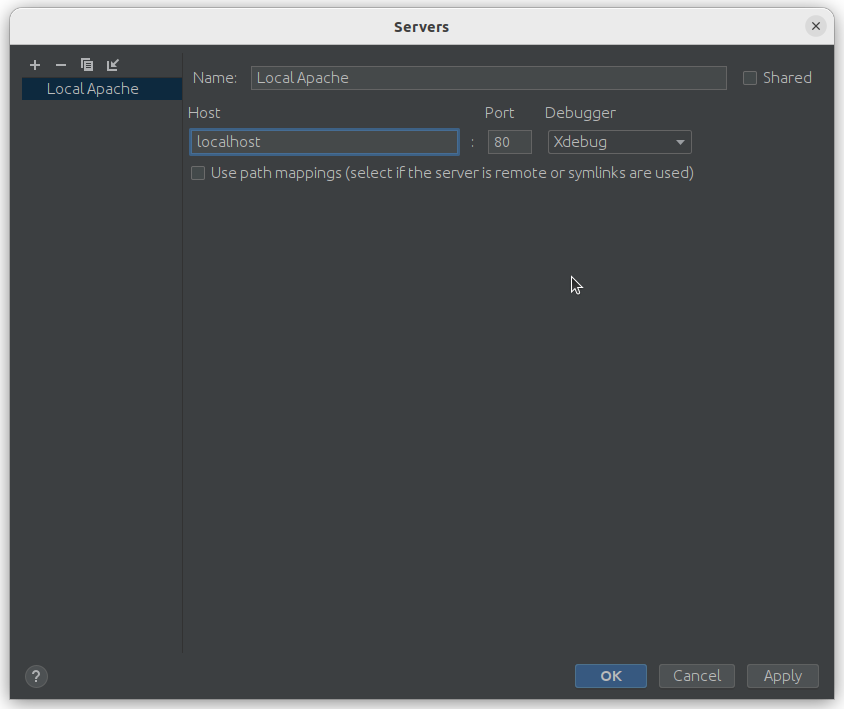
Our server is running on localhost:80 and using Xdebug so those are the appropriate values. Click “OK” to dismiss. Now back on the Run configuration button we can select the “Local Apache” server we just created. The Xdebug IDE Key we will be using is for PHPStorm which is PHPSTORM.
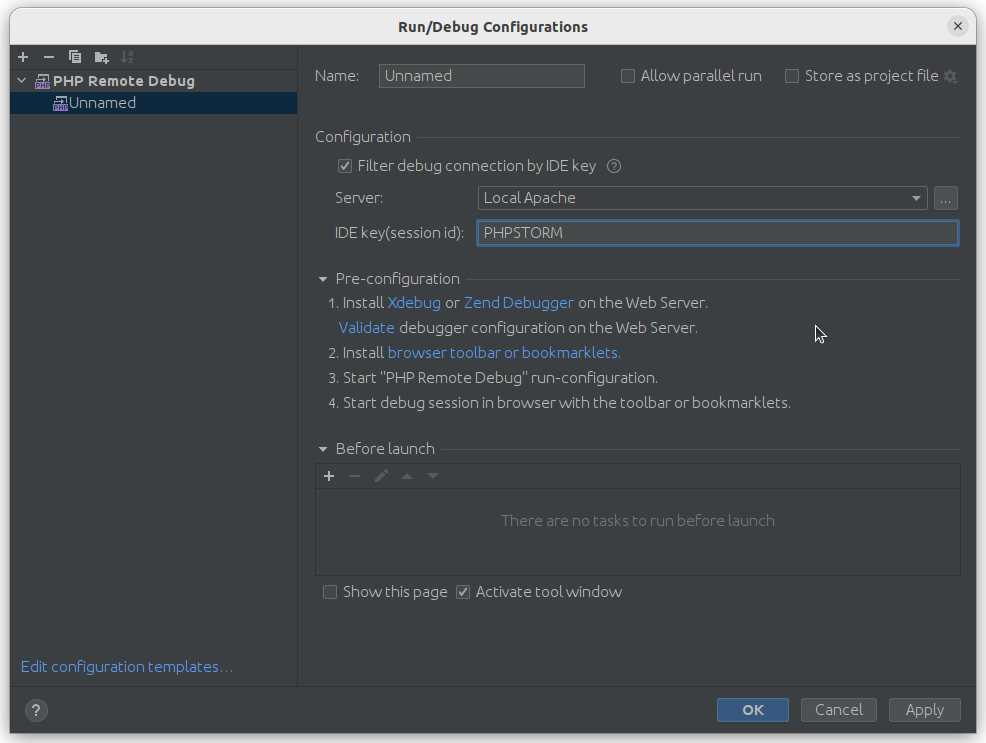
Now we can validate that our server can accept debug connections. Click on the “Validate” text under the pre-configuration step. This will bring up the below validation window.
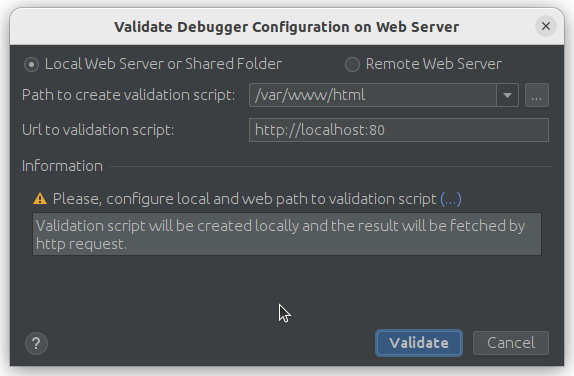
These default settings are correct so you can just hit the “Validate” button. If you completed all of the above steps correctly you should see a window with all green statuses like below:
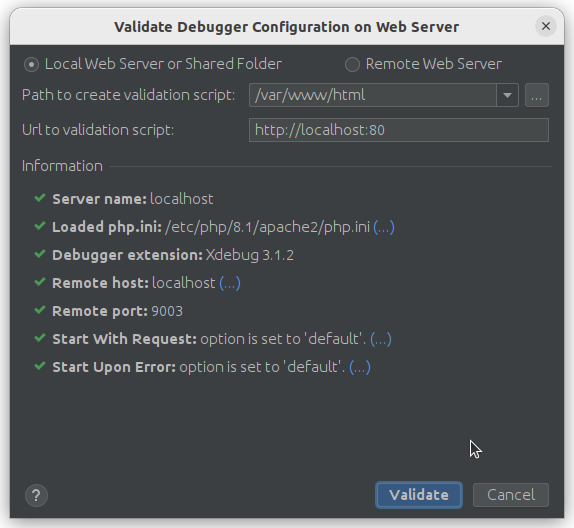
If you see any warnings/errors then one of the above steps wasn’t completed correctly. A potential common issue is that the config file doesn’t have xdebug set correctly (a typo) or the Apache process wasn’t restarted. Assuming all is well then we can begin trying to do our debugging.
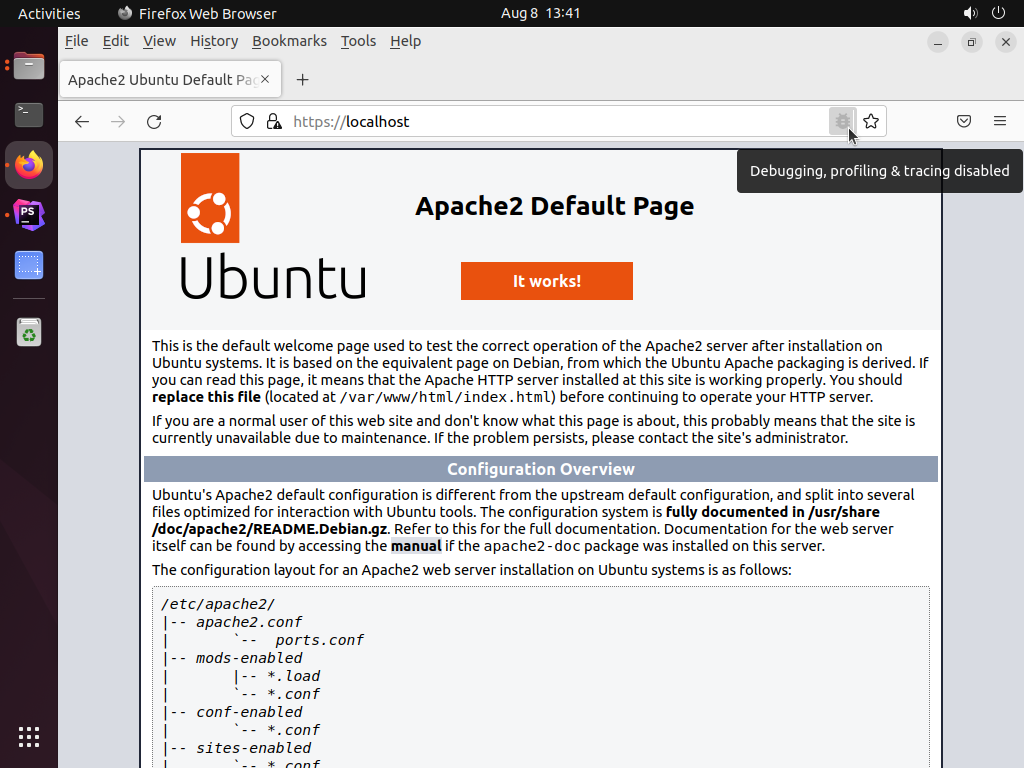
Bring up the home page in your web browser at https://localhost. As you can see from the below screenshot once you have the Xdebug Helper plugin in the browser your Address Bar will have a debug menu item at the end of it.
Clicking on the menu brings up a list of options to debug, trace, profile, or disable. We want to enable the Debug option.
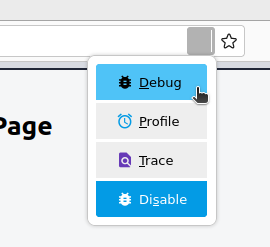
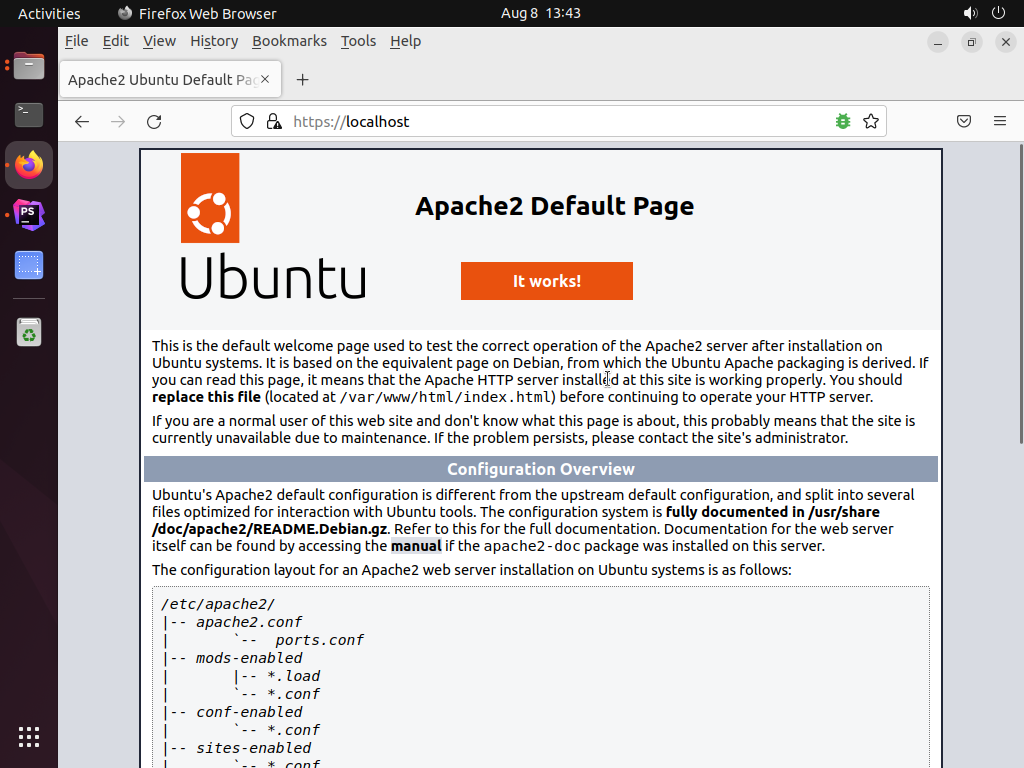
Clicking on this will show a now green rather than grayed out bug.
We are now ready to tell PHPStorm to start listening for debug events. Go back into PHP Storm. In the Run Toolbar you see an icon with a phone receiver which allows us to start listening to server debug events, see below.
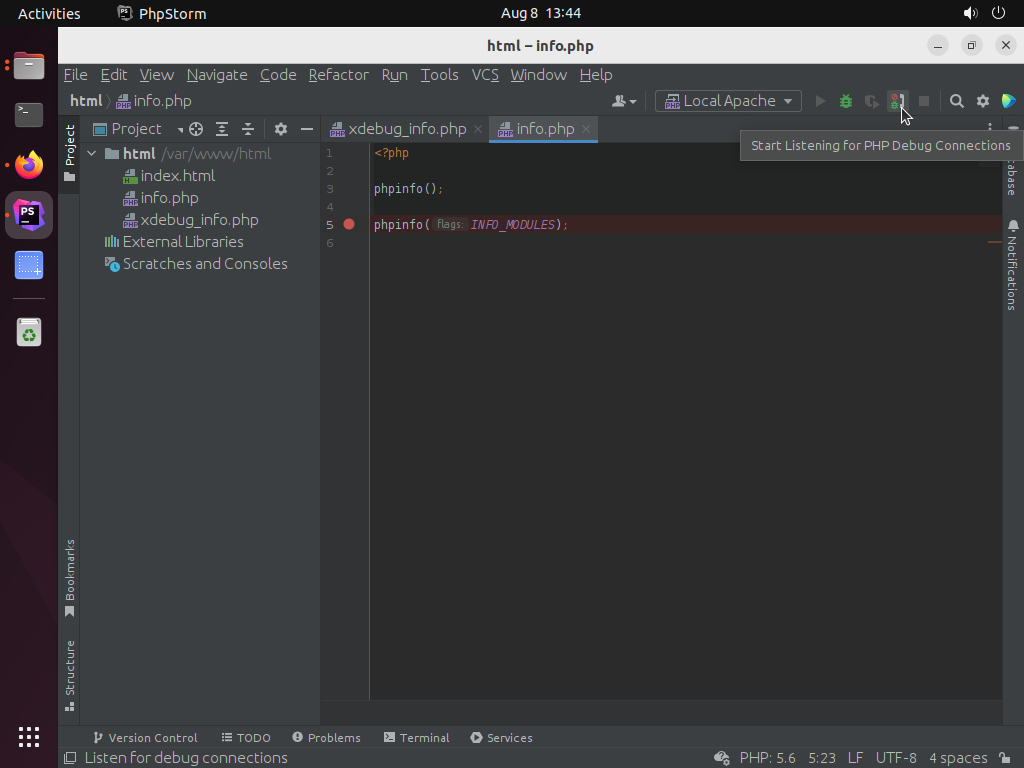
Click on this to have PHP start listening to everything. The browser is now configured to have debug events to be generated by the server when we navigate to a PHP page. Navigate to https://localhost/index.php (or the regular HTTP link if you didn’t setup the HTTPS server). This will cause the breakpoint to be triggered in our site. Since we connected to the HTTPS version not HTTP, PHPStorm will bring up a configuration wizard to add this configuration to our existing server:
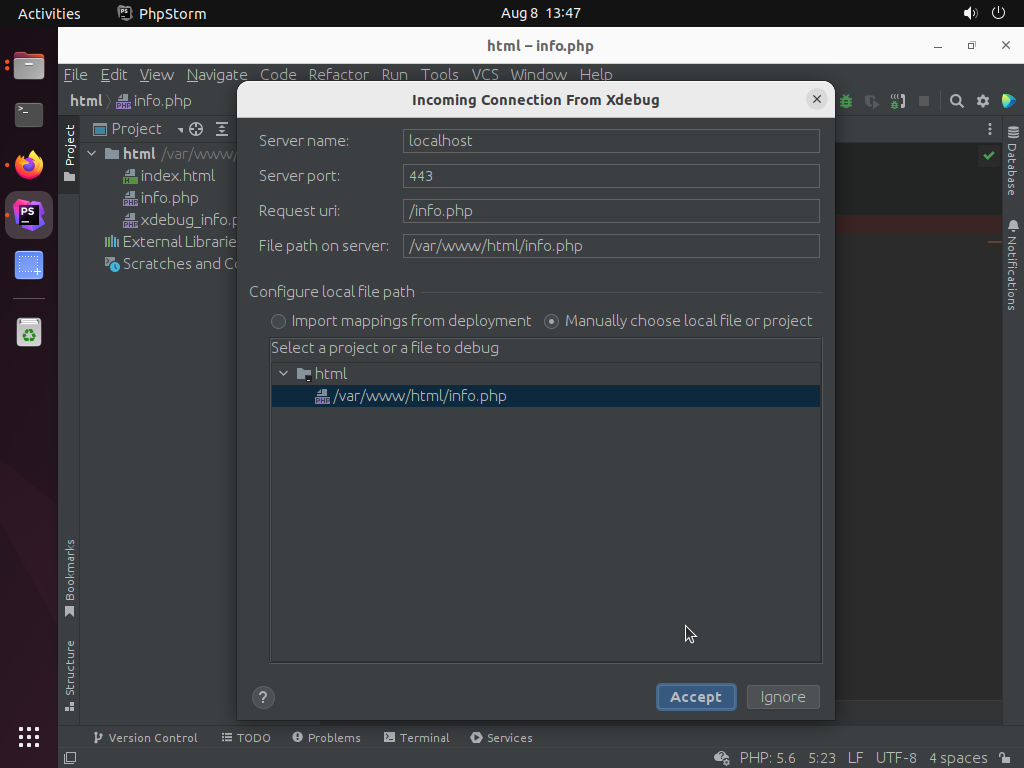
Accept the defaults and hit OK. You will then drop into the debugger stopped at the last phpinfo line.
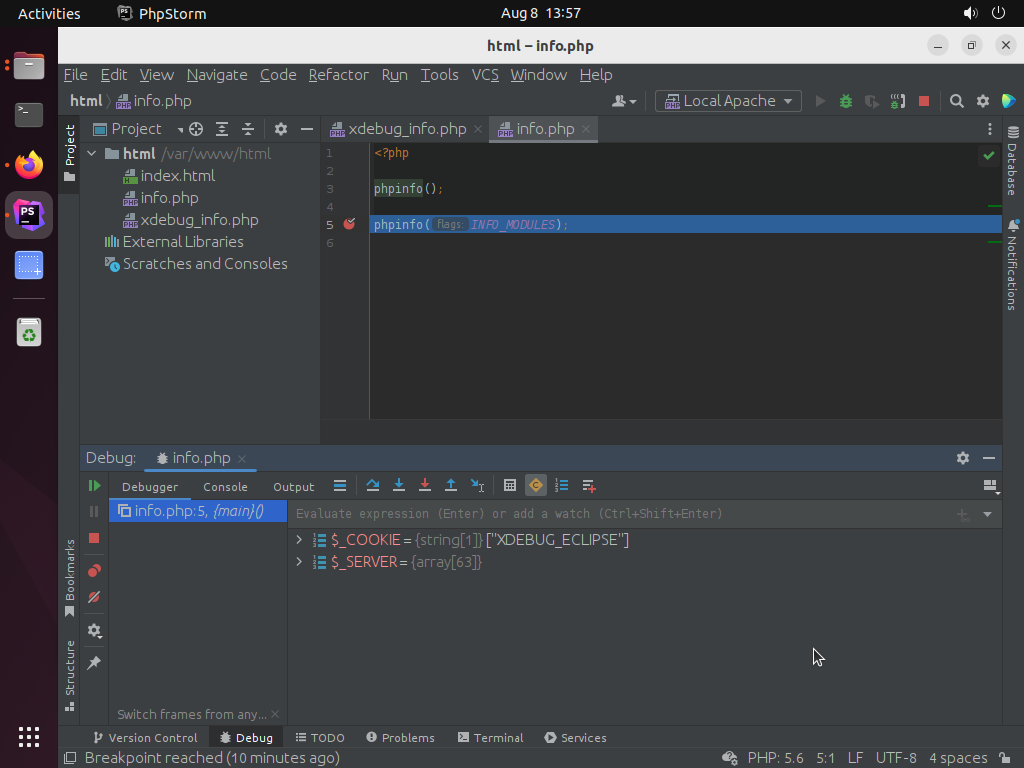
You have now successfully started debugging your Apache hosted local site.