


 2021-05-03
in
2021-05-03
in

 5 min read
This is an update on my monthly blog stats generated with my non-tracking The BlogStatViewer program. I followed the same steps as in last month’s post for refining the updates to make sure that bots/spiders/etc aren’t in the statistics. This month it took a grand total of ten minutes cleaning up about a dozen new bot type accesses. Below are the updated stats for the month of April.
At the very top level of statistics I had 2776 views across my whole blog from 1755 unique IP addresses. That’s a little less interaction than last month. The top ten IP addresses with the most number of views are below. There is no outlier this month which I had to question and the clustering looks a bit closer.
| Position | # Views |
|---|---|
| 1 | 54 |
| 2 | 40 |
| 3 | 40 |
| 4 | 23 |
| 5 | 21 |
| 6 | 20 |
| 7 | 19 |
| 8 | 18 |
| 9 | 16 |
| 10 | 15 |
The top stories that were linked to all are with respect to software development. Again the overwhelming majority of the top stories were around Avalonia development, but the order and counts are a bit different in the middle of the pack. Kotlin had one in the top with the story on native I/O. An article on GPL I forgot I wrote back in 2016 came up too. I’ve been having more interactions on open source licensing and have been meaning to write about it but haven’t yet. I’m curious if that’s what caused that to pop to the surface. It is interesting that even though I now prefer copyleft licenses I still agree with what I wrote in 2016, back when I was more a fan of permissive open source licenses. Below is the table of the stories with their link counts:
Top 10 Links:
The rest of the statistics I’m interested fall into:
- Referrer for that view, which is broken down into internal and external referrers. An “internal” referrer is basically following a link from the blog itself. An external referrer is from a search engine, a link from another website, a social media link etc. Browsers don’t necessarily provide this information though and if they went to the post directly there isn’t referrer information either.
- The browsers of the viewer that visited the site. This is a bit nebulous because browsers often impersonate other browsers. Some browsers don’t fill in the data at all. I’m just taking the signatures at face value for the major browsers.
- The operating systems the viewers’ browser is running on. Again this isn’t always avalailable in the data and may be impersonated. Just as with the browser I’m taking the values at face value.
Graphs and percentages discussed below within a category are for only visits that I had the information to analyze. The fraction of the visits that had that information will be mentioned as well though. First let’s look at the referrer information
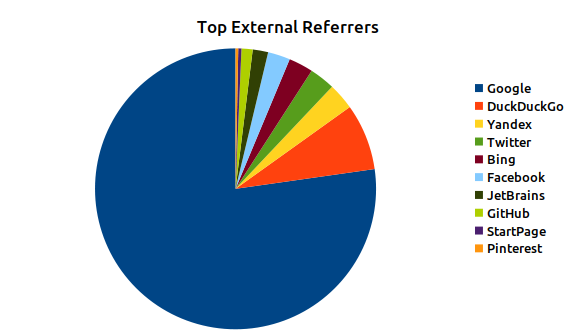
Figure 1: April 2021 Top External Referrers
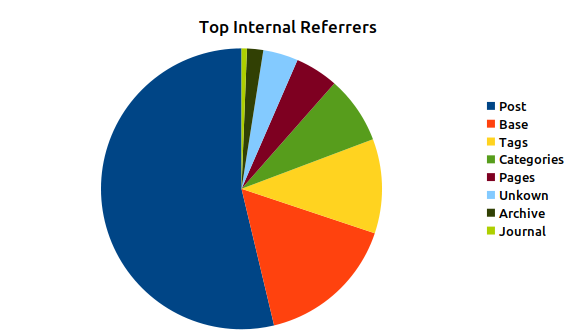
Figure 2: April 2021 Top Internal Referrers
Looking at the external referrers Google is again the most dominant, with 77% of external referrers from it. DuckDuckGo again came in a very distant second and most of those are probably from my menu bar since it uses DDG as it’s search engine.
In terms of internal referrers the biggest chunk of referrers are users clicking through from one post to another post that it linked to. Posts were a much bigger percentage than last month’s The next biggest was me the main site page followed by Tags. Categories and tags flipped spots since Categories were used a lot less.
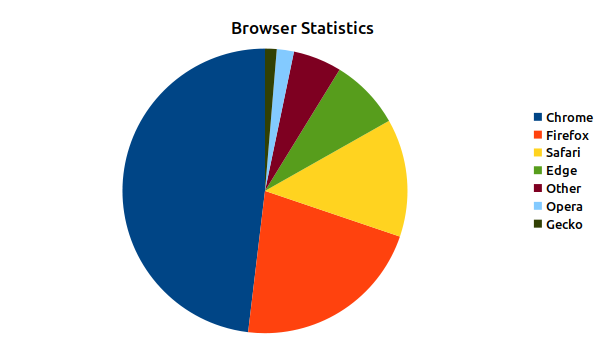
Figure 3: April 2021 Browser Statistics
In terms of browser data Chrome edged up slightly to 48% of views and Firefox dropped from 26% to 23%. Safari picked up one percentage point to 13% and Edge keeps showing up more too.
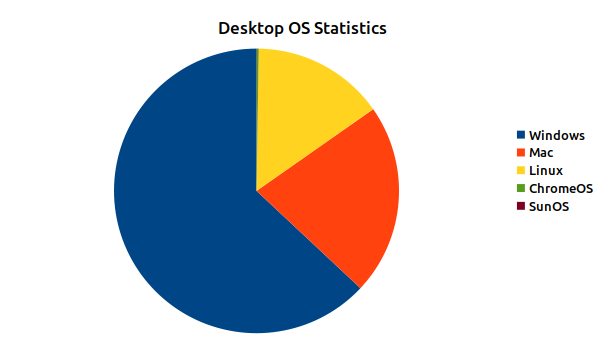
Figure 4: April 2021 Desktop OS Statistics
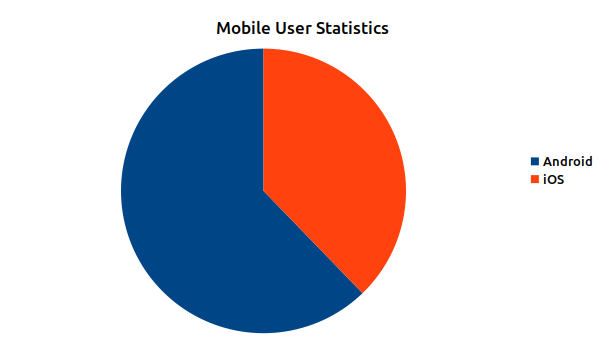
Figure 5: April 2021 Mobile OS Statistics
Lastly lets look at the operating system statistics. From the desktop perspective Windows dominates with almost two thirds of the views (63%) but Mac (22%) showed up more frequently than Linux (15%) this time around instead of a near even split. Chrome OS showed up on a few hits as did SunOS for one. I always like when more esotoric systems show up. With OpenIndiana having a new release I’m thinking of giving that another spin so that made the SunOS hit a little sweeter. In terms of Mobile OS’s Android’s dominance is still there at 62% which is down slightly from last month’s 65% and the rest (38%) going to iOS.
Conclusion
The stats are pretty status quo. I’m glad that the update process isn’t too onerous still. At the same time the dozen flagged IP addresses could probably be automatically flagged if I upgraded the system to do such a thing. I think I may put that into a feature request